In this blog, we will be learning about purpose of Root Cause Analysis (RCA) and how to leverage for manufacturing operations to reduce the wastes.
What is the Root Cause Analysis?
Root Cause Analysis is a systematic approach used to pinpoint the underlying reasons behind issues that impact quality assurance, production efficiency, lead times, and operational costs throughout the entire manufacturing cycle. It serves as a vital component in manufacturing processes.
Traditionally, manufacturers have focused on addressing immediate faults to resolve problems quickly. However, this approach often falls short of delivering long-term solutions, as the true root causes behind recurring defects remain unidentified.
With manufacturing involving intricate and extensive processes, Root Cause Analysis plays a crucial role in tracing problems or defects back to their origins, enabling manufacturers to implement effective, lasting solutions.
This blog aims to help you explore the nuances of root cause analysis in manufacturing.
Root cause analysis in manufacturing is a distinct process focused on investing the root causes of defects in manufacturing processes or final product. Specifically, root cause analysis in manufacturing aims to recognize that defects in manufacturing can be traced to root causes that are to be rectified in order to achieve long-term efficiency in production and ensure high quality.
Root cause analysis in manufacturing does not treat symptoms of defects alone. By employing different suitable methods, it aims at identifying and rectifying the primary issue causing defects at various capacities in manufacturing.
Root Cause Analysis Examples in Manufacturing
Machines / assets are primary resources in manufacturing. Ensuring that machines function to full potential is essential in achieving optimized production performance.
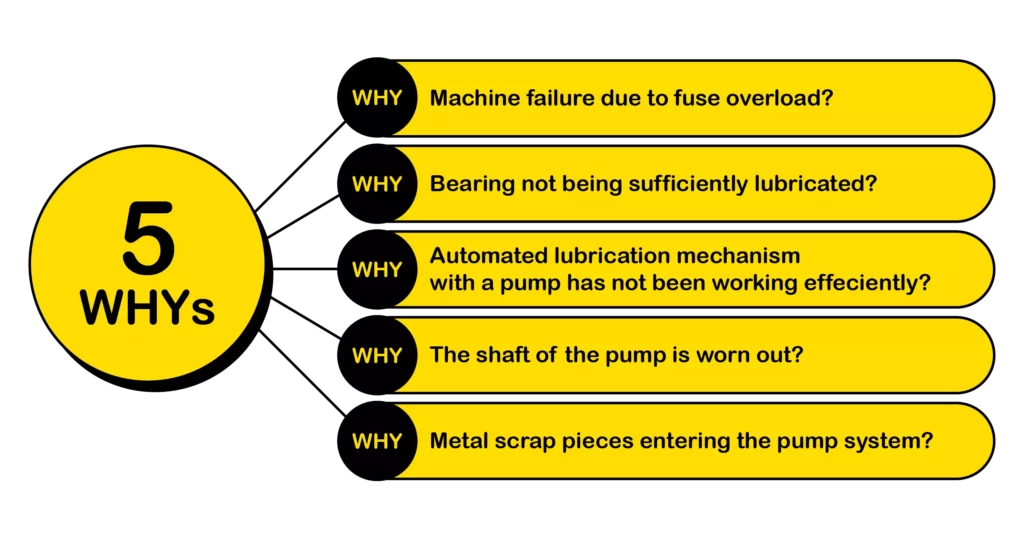
On the same lines, as a root cause analysis example, let’s consider a machine in your manufacturing unit has had fuse blown off resulting in a stopped machine. In the absence of root cause analysis, you would probably replace the fuse or check why the fuse blew off.
When the root cause analysis methods are applied, investigation begins. You start to question why a certain issue / event has occurred, events occur before incident, part produced and other activities in the machines to eventually tracing it to the root cause.
You begin to investigate why the fuse blew off and find out the bearing is not being sufficiently lubricated. Further scrutinizing is encouraged and you find out that the automatic lubricating system with a pump had not been sufficiently pumping.
Further review points to the worn shaft being unable to support the pump system to function efficiently. You continue to look into reasons for the worn shaft and discover that metal scraps were getting into to pump causing the worn shaft to adversely affect the automatic pumping system.
With the root cause analysis being employed, you manage to investigate to the root of the cause. In this case, the insufficient mechanisms to prevent the falling of metal scrap into the pump system was the real reason for the blew off fuse causing the machine to stop.
Finding the root reason directs manufacturers to rectify the issue of metal scrap entering the pump and prevent recurring fuse issues.
Benefits of Root Cause Analysis
Benefits of root cause analysis are identified as a critical component in flexible manufacturing processes; like that of lean manufacturing, six sigma. The primary benefit of root cause analysis remains that it optimizes time required to narrow-down to cause of a problem and mitigating recurrent issues. Some of the other important benefits are listed below.
Cost Savings
Root cause analysis in manufacturing focuses on rectifying the ‘illness / root defect’ rather than treating ‘symptoms / immediate issue’. With this system of operation, downtime decreases, recurrence of defects reduce and production process improve resulting in reduced expenditure. Along with cost savings, significant increase in revenue can result with the practice of root cause analysis in manufacturing.
Automation
Most companies today have access to ample data relating to operations within their units. A root cause analysis system can be integrated into existing systems of operations to automate procedures of analysis and improve efficiency.
With the data gathered by root cause analysis and existing connected systems, data on defects and findings can be shared with different units of the company. This will create awareness and enable units of a company stay informed and work towards preventing recurrence of defects in manufacturing.
Proactive Process
With integration of systems that allow and practice real-time analysis (automation), root cause analysis serves as a proactive process. Root cause analysis enables foreseeing of concerns relating to maintenance, safety / compliance and quality through data availability, ongoing analysis and scrutiny, via integration of systems and processes. With foreseeing of such concerns, it helps to channel prevention of such obstacles.
Long-Term Solutions
Many companies work with partially disconnected and broken processes. Root cause analysis provides practical solutions and establish SOPs that can be adhered without cutting corners or deviating from existing procedures of operation. Root cause analysis creates lasting (long-term) solutions as a result of the viability and applicability it offers.
How to perform Root Cause Analysis?
Performing a root cause analysis will differ from company to company and problem to problem. Root cause analysis can be used for bottleneck analysis between departments of a company, identify factory-wide defect identification or zeroed in on a specific machine defect across a specific OEM type.
Whatever be the reason, generally a protocol exists in performing a root cause analysis to ensure its effectiveness in tackling challenges and implementing solutions. The general steps in performing a root cause are listed below.
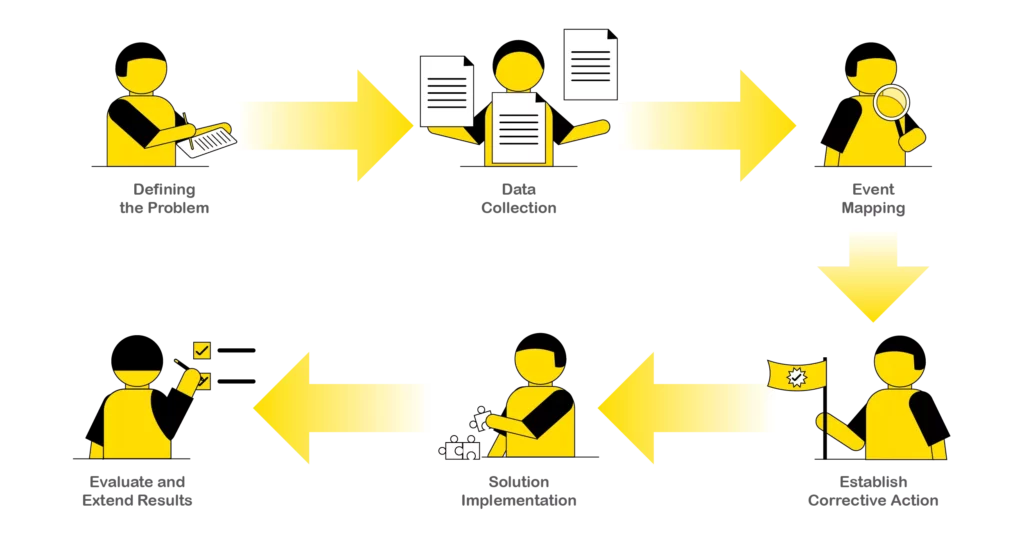
Defining the Problem
This is the first and crucial step in performing root cause analysis. It simply reflects the obvious fact of statin the problem. As simple as it seems, defining the problem, the symptoms (reoccurring issues), visible conditions and implications establishes the scope and directs your analysis.
Writing a clear problem statement is essential. Lack of a problem statement can be challenging to identify clear channels for problem-solving. A thoroughly defined problem statement helps define, the scope and scale of solutions to be implemented.
Data Collection
Collecting all data relating to the incident in examination is another crucial step in performing root cause analysis. Record every detail and elaborate the same. For example, you can jot down answers to questions like; what is the proof / evidence for the issue?
How long has it been since the issue crept in? what has been the impact of the issue so far and what will be the future repercussions?
In today’s industries, it is a lot easier to locate and leverage data for root cause analysis, given the nature of OEM equipment that allow manufacturers to embed data collection mechanisms.
It can also imply that some equipment that do not natively contain data collection capacities have additional devices to extract data specific to different parameters at real-time.
Event Mapping / Cause and Symptom Identification
Following data collection is the mapping of events to establish a timeline. It will help in identifying key factors that further require examination and eliminate the others. Data points can be categorised as causes and symptoms to further identify correlation. Root cause analysis requires only potential data points that will lead to the root cause an event.
Correlation between data points can be recognized with the mapping of events. Although correlation does not imply causation, the chronological sequencing and clustering of events can be used to create casual graphs. Casual graphs can be employed to show relationship between actual event occurrence and data collected.
These graph paths are analyzed with probability weights to narrow down to the root cause.
Establish Corrective Action
With event mapping, ideally the root cause is zeroed-in and determined. Following this step, an effective solution can be crafted. Establishing a corrective action might include training, mechanical replacements / modification, process alterations, factory structure, robust data collection or analytical capabilities. Access to real-time data and insights can trigger manufacturers to curate practical solutions with log-term applicability to root-causes in manufacturing.
Solution Implementation
Once the root cause is identified and the corrective action is established, the team is required to implement the solution. Implementation process could translate to replacing or revising SOPs, crafting new workflows, assessing policies and procedures along with auditing finances to account for change implementation. Deeper assessments and analysis of solution implementation methods will enhance the overall effectiveness of the solution being implemented.
Corroborate and Extend the Results
An audit process is what forms the basis of a long-standing solution. This audit piece is required to corroborate effectiveness of the solution. Validating and corroboration of solution is possible with robust collection of data that is subjected to real-time analysis. With access to real-time data, implemented solution to rectify root cause can be monitored and amended to improve the effective of solution in operation. If with the audit process, it is discovered that the implemented solution is successful in eradicating the root cause, it can further be extended to resolves issues in different departments of the company.
Root cause analysis can be taken up manually, it is much more effective when combined with real-time data collection and analysis. It is quick and reliable with AI enable data analysis where solution can be audited timely and rolled out to other departments and units of the company.
Tools of RCA
Tools are methods employed by manufacturers / companies to pursue a root cause analysis with a goal of identifying root cause for recurrent failures or defects in the manufacturing process.
Some of the critical tools/methods used for root cause analysis in manufacturing are described below:
Fault Tree Analysis
This tool was developed in Bell Technologies to evaluate an Inter-Continental Ballistic Missile (ICBM) launch control system for the U.S Air force. Fault tree analysis (FTA) is a tool that employs Boolean logic (AND, OR, NOT) to find the cause of process or equipment failure. FTA uses the top-down approach by reverse-engineering root causes that could result in a potential defect and eventual failure.
Primarily, the fault tree analysis method attempts to identify the trajectory of a failure by mapping logical relationships between faults and subsystems of a machine. FTA replicates the movement of defect / failure through a system itself. FTA takes to create a graphical representation of how component failures led to system-wide failure if unresolved. Typically, these analytical graphs used to model FTA look like trees and probably hence the name fault tree.
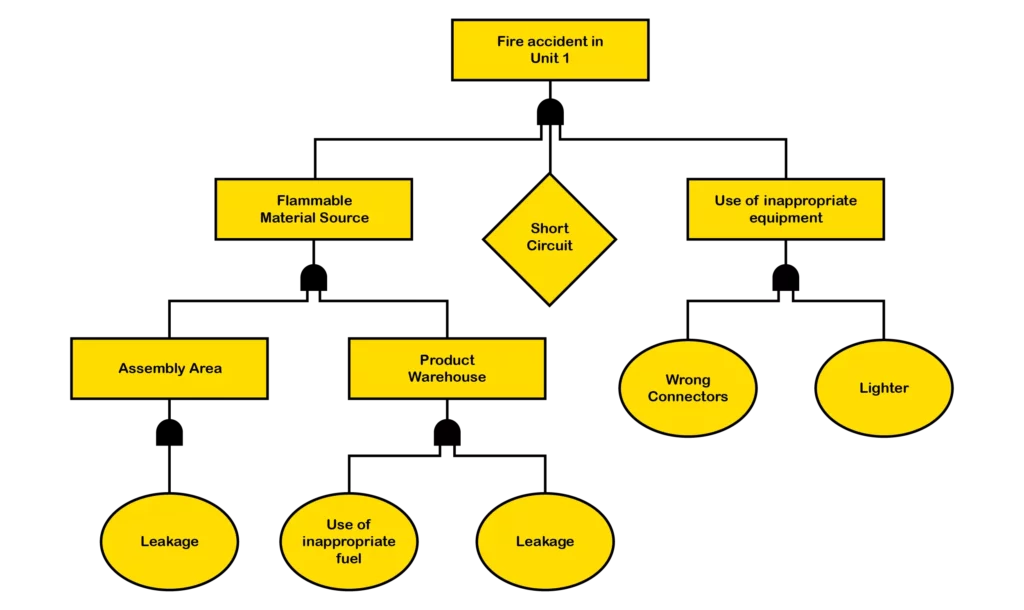
The fault being analysed is placed at the top of the chart. If two or more causes have a logical OR combination causing effect, it is then identified as logical OR relationship. For example, a machine could fail when in maintenance or operation, this condition can be listed as logical OR relationship. While on the other hand, if two causes have to occur simultaneously for the defect or fault to happen, then it is represented with a logical AND. For example, if a machine fails only when the operator pushes the wrong AND. As shown in the diagram above, the blue symbol denotes logical AND relationship, while the purple symbol denotes logical OR relationship.
The Five Whys
At Toyota factories for the purposes of root cause analysis, the five whys tool was developed originally by Sakichi Toyoda. This technique of root cause analysis is simple, clear and neat. The five whys method emphasises on simply asking ‘Why’ a certain fault has occurred in the manufacturing. The idea is that one ‘why’ triggers another and another until the root cause is identified. Five whys method can be continued beyond five questions until the logical root cause is recognized.
As the thumb rule implies, asking 5 five subsequently will be enough to land at the root of a defect or problem, hence the tool derives its name ‘The Five Whys’. Although, it can be continued till you arrive at the root cause. The image below provides a depiction of the 5 whys root cause analysis method.
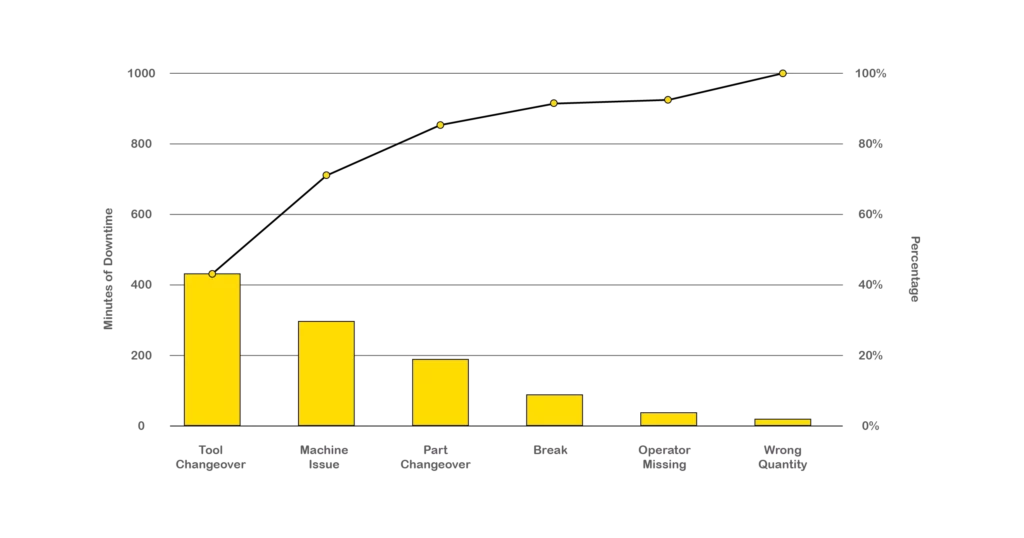
Pareto Charts
Pareto charts are another tried and tested tool for performing root cause analysis. Pareto charts indicate the frequency of defects and its cumulative effects. A common theme between all distributions of frequency was observed and recognized by Vilfredo Pareto, an Italian Economist. He observed and noted that there is a significant imbalance between the ratios of failures and its effects.
Pareto proposed that in any system 20% of potential reasons cause 80% of failures (results). It is also known as the 80-20 rule. This principle forms the crux of Pareto Charts useful in the process of root cause analysis.
With the 80-20 principle, you can begin to draw the graph that includes defeats (faults) and causes. Once you graph is completed, typically you will be able to see how majority of faults are caused by a low percentage of factors. Following this, you will then be able to identify causes that contribute largely to recurring faults, analyse it and craft solutions to rectify root causes.
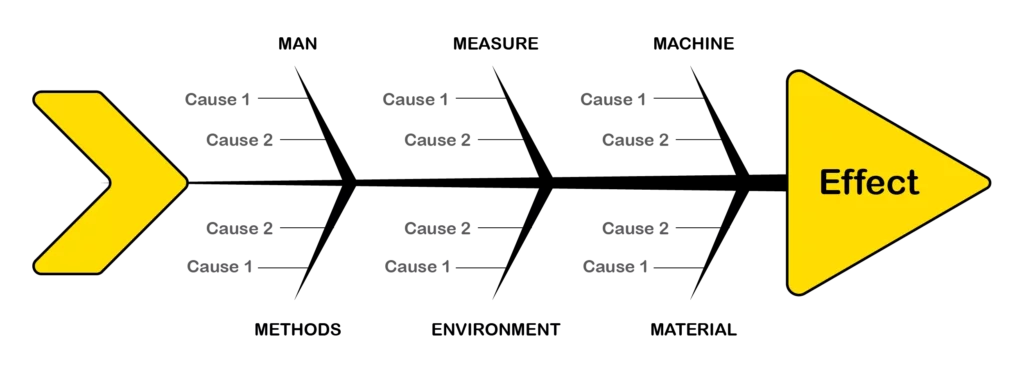
Fishbone Diagram
The fishbone diagram also know as the Ishikawa method for root cause analysis derives from quality control techniques employed in the Japanese ship building industry by Kaoru Ishikawa. The resulting diagram shape looks like that of a fish, and hence bares the name Fishbone diagram. The diagram is built with the concept that multiple factors contribute to a failure/fault/event/effect.
The problem is written on the extreme right, replicating the position of the fish head. Following this, a horizontal line is drawn from right to left, representing the cause of the problem. Further the effects and their respective cause are written along the fish bones that can also be in line with the 5M framework (Man, Machine, Material, Methods and Measurement). Until the team is convinced with evidence of the actual root cause, fishbone diagram can be employed continually.
Failure Mode and Effect Analysis (FMEA)
FMEA is a common process analysis tool. It aims at identifying root cause of all possible faults and defects in design, manufacturing or a particular process, product or service. Failure modes refer to ways / modes in which something can fail. Effect analysis refers to the study of outcomes or consequences of a failure or defect.
FMEA follows a proactive approach combining the efforts of quality assurance & control, reliability engineering, and safety engineering. When employing FMEA a cross-functional diverse team is essential to conduct the process seamlessly. The scope of the analysis must be clearly defined and communicated to the entire team. Each design, system, subsystem and process will be reviewed.
During an active FMEA, potential failure modes are brainstormed whilst examining faults and failure events of the past. Potential effects and disruptions that could be caused by each identified failure is evaluated and the RPN is calculated.
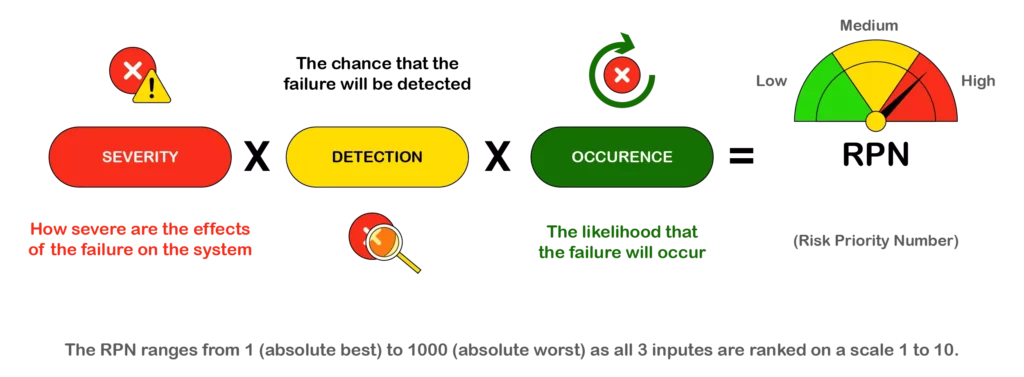
In case of a higher RPN, the company can look into changing a few factors as outlined in the above image. In case of a lower risk priority number (RPN), the process, design, and/ or manufacturing seems to be doing well without high potential risk ahead.
Having now analysed the tools to conduct root cause analysis, it’s time to begin employing techniques these and many other methods that support root cause analysis to ensure efficient production with cost-effective investments and optimized resource utility.
Conclusion
On a concluding note, root cause analysis in manufacturing is essential. Often though recurring faults have root causes that required to be rectified in order to completely rectify the faults and potentials failures. Root cause analysis in manufacturing helps monitor processes and assets for enhanced performance and reduced unplanned downtimes. It ensures a healthy manufacturing process from start to finish.
FAQs
1.What is Root Cause Analysis (RCA) in manufacturing and why is it important?
Root Cause Analysis (RCA) in manufacturing is a systematic approach used to identify the underlying reasons behind defects, equipment failures, or process inefficiencies.
Instead of just treating surface-level issues, RCA helps manufacturers uncover the true cause of problems, enabling them to implement long-term, sustainable solutions. It’s critical for improving production efficiency, reducing operational costs, and maintaining high product quality.
2.How does Root Cause Analysis help reduce production downtime and maintenance costs?
RCA minimizes downtime by diagnosing the exact reason behind recurring issues and addressing them at the source. This leads to fewer unexpected failures and reduced maintenance frequency. Over time, it saves on repair costs, increases equipment reliability, and streamlines overall production workflows.
3. What are the most common Root Cause Analysis tools used in manufacturing?
Some of the most effective RCA tools include:
- The 5 Whys: A method of repeatedly asking “why” to dig down to the root cause.
- Fishbone Diagram (Ishikawa): Visual tool categorizing potential causes across areas like Man, Machine, Method, etc.
- Fault Tree Analysis (FTA): A logic-based diagram to trace failures through a system.
- Pareto Charts: Based on the 80/20 rule to prioritize issues that cause the most defects.
Failure Mode and Effects Analysis (FMEA): A proactive tool to analyze potential failure points and their impact.
4. What are the key benefits of implementing Root Cause Analysis in manufacturing operations?
RCA offers several operational benefits, including:
- Cost savings by eliminating repeat problems
- Proactive maintenance through data-driven insights
- Increased production uptime
- Improved product quality
- Better cross-departmental collaboration through shared insights and data